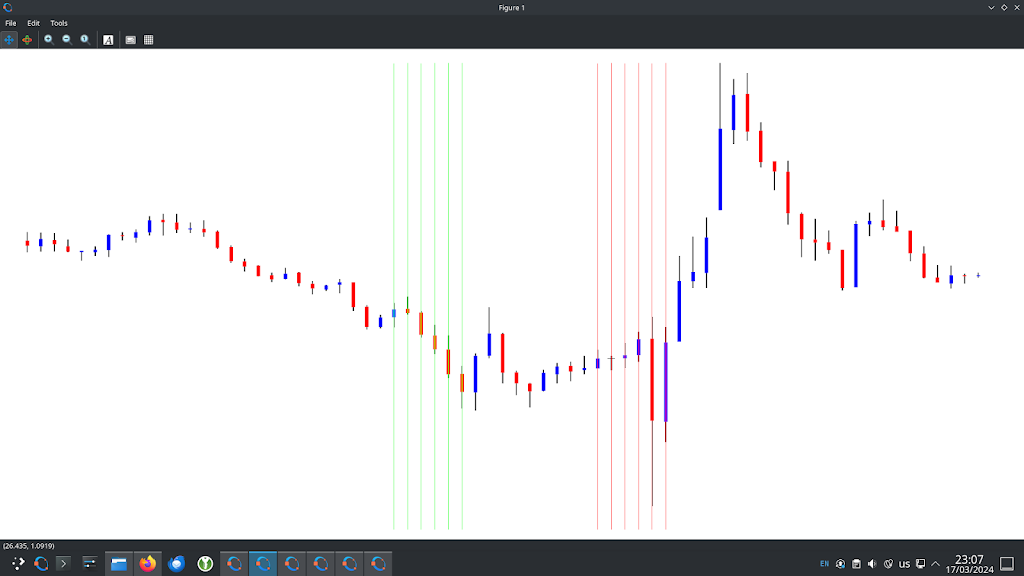
In my previous post I suggested three different approaches to using PositionBook data other than directly using this data to create new, unique indicators. This post is about the first of the aforementioned ideas: modifying existing indicators that somehow incorporate volume in their construction.
The indicators I’ve chosen to look at are the Accumulation and Distribution index, On Balance Volume, Money Flow index, Price Volume Trend and, for comparative purposes, an indicator similar to these utilising PositionBook data. For illustrative purposes these indicators have been calculated on this OHLC data,
which shows a 20 minute bar chart of the EUR_USD forex pair. The chart starts at the New York close of 4 January 2024 and ends at the New York close on 5 January 2024. The green vertical lines span 7am to 9am London time and the red lines are 7am to 9am New York time. This second chart shows the indicators individually max-min scaled from zero to one so that they can be more easily visually compared.
In hindsight, by looking at my order levels chart
and volume profile chart


