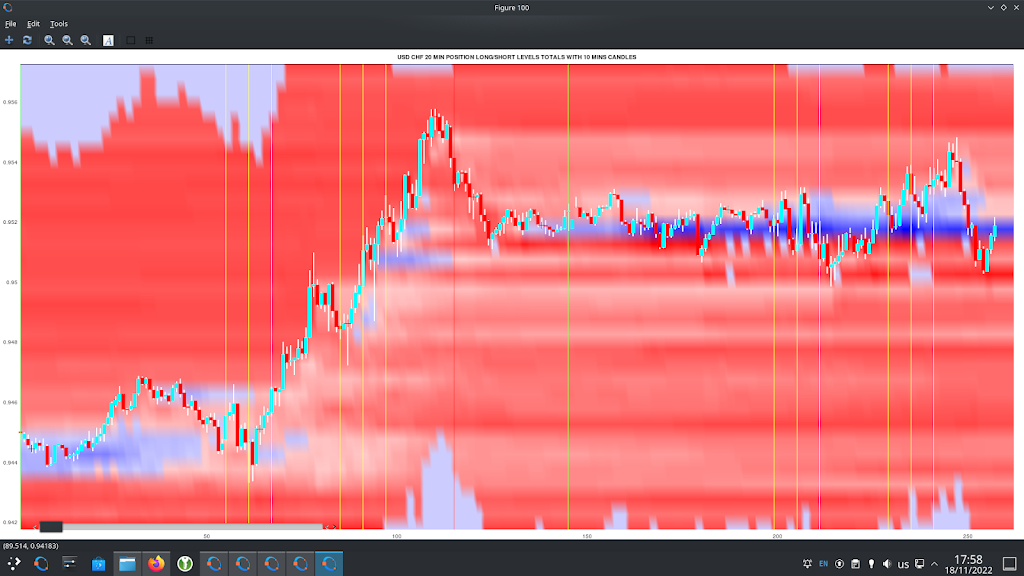
As a quick follow up to my previous post I thought I’d show an example of how one could possibly use my new PositionBook chart as a trade set-up. Below is the USD_CHF forex pair for the last two days
showing the nice run-up yesterday and then the narrow range of Friday’s Asian session.
The tentative set-up idea is to look for such a narrow range and use the colour of the PositionBook chart in this range (blue for a long) to catch or anticipate a breakout. The take profit target would be the resistance suggested by the horizontal yellow bar in the open orders chart (overhead sell orders) more or less at Thursday’s high.
I decided to take a really small punt on this idea but took a small loss of 0.0046 GBP
as indicated in the above Oanda trade app. I entered too soon and perhaps should have waited for confirmation (I can see a doji bar on the 5 minute chart just after my stop out) or had the conviction to re-enter the trade after this doji bar. The initial trade idea seems to have been sound as the profit target was eventually hit. This could have been a nice 4/5/6 R-multiple profitable trade.😞


